Objective: This experiment tried to simulate the warming of an atmosphere and the effects of greenhouse gases within an atmosphere. To do this, we placed a temperature probe within a clear plastic 2 liter bottle and placed the bottle under light from either a lamp or the sun. We recorded the temperature of the warming bottle for ten minutes, moved the bottle out of the light and recorded for an additional five minutes. We repeated this procedure for three trials. The first trial, the bottle was empty; in the second trial, the bottle contained 200 mL of water; in the third trial, the bottle contained 200 mL of water and excess carbon dioxide from the dissolving of an alka seltzer tablet.
Data:
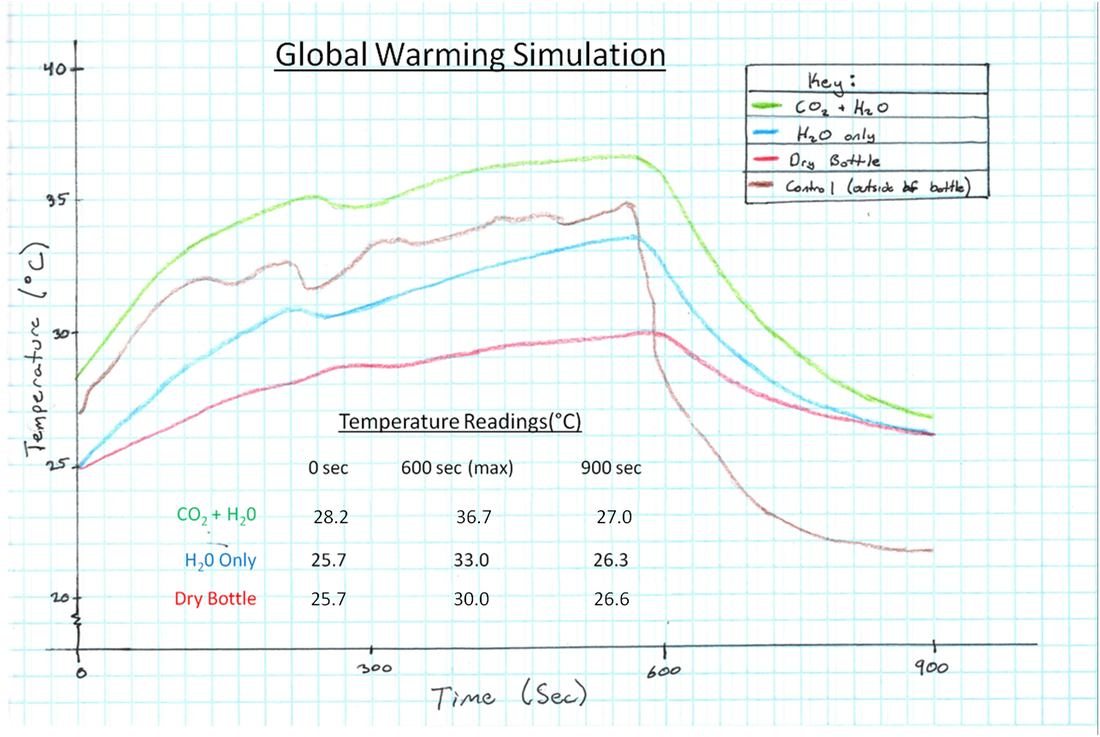
Compiled Data:
Compiled Data:
Raw Data:
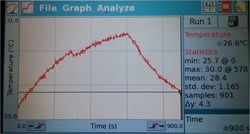 Dry Bottle | 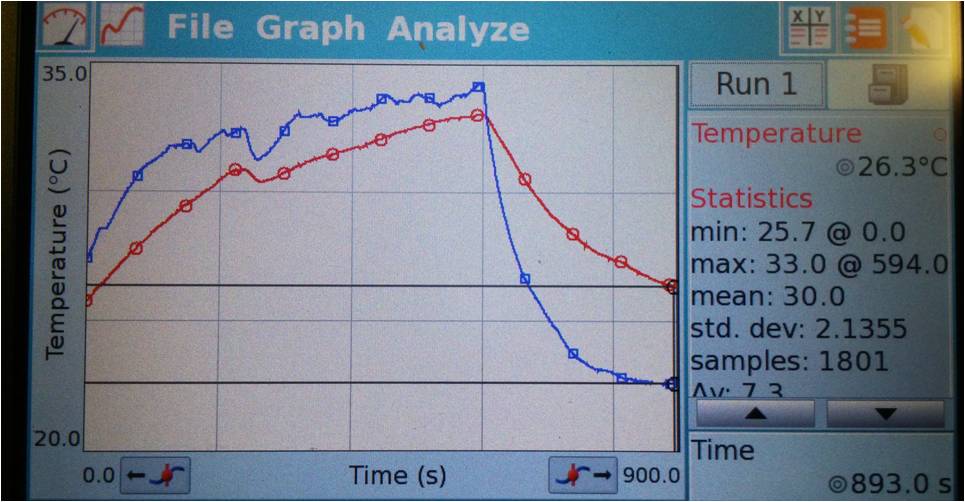 Water Only | 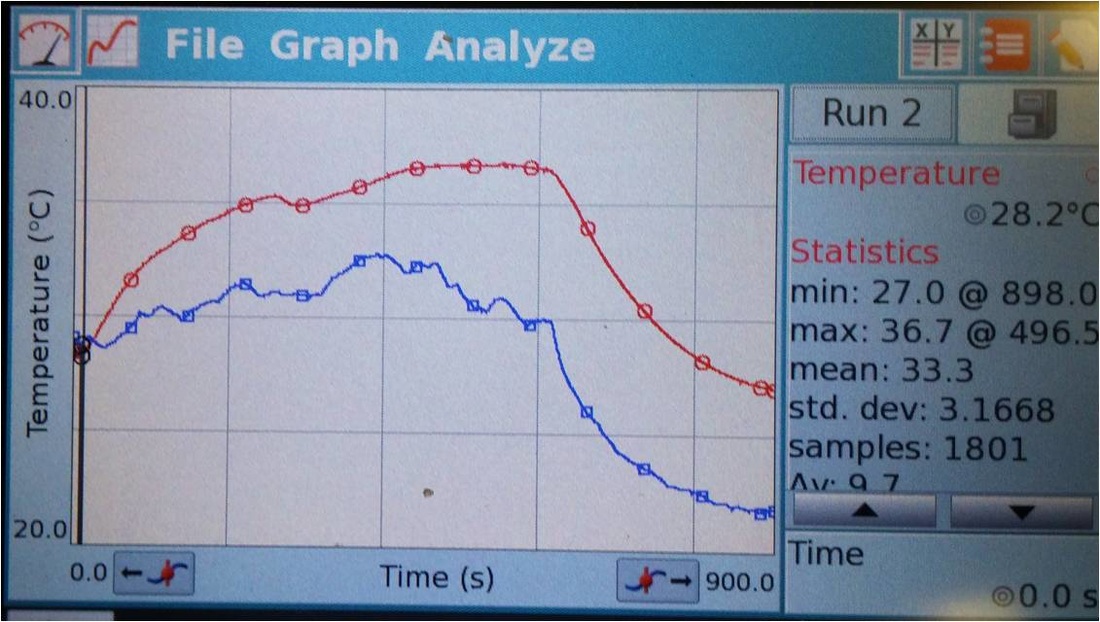 Water & Carbon Dioxide |
Conclusion Questions:
1. Describe the general characteristics of each of the graphs.
1. Describe the general characteristics of each of the graphs.
- Each graph has approximately the same general shape. All graphs increase at a slowing rate until the heat source is taken away, although the rate of increase is different for each, and then they all decrease at a slowing decrease rate, with these rates being similar for each graph. There is a dip on all three graphs at about 300 seconds where the temperature stops increasing temporarily, although I believe these dips to be coincidences that occurred from shade or the turning off of the lamp.
- The bottle with the greatest temperature increase was the bottle containing both carbon dioxide and water with an increase of 8.5 degrees Celsius compared to 4.3 and 7.3 of the other two bottles. This occurred due to the presence of both water vapor and carbon dioxide in the bottle, which are both greenhouse gases that are able to trap heat within the bottle. the other bottles contained either no greenhouse gases or only water vapor which has a lower ability to trap heat and is at a lower concentration than the greenhouse gases in the first bottle.
- The bottles cooled off at only slightly varying rates. Warmer bottles cooled more quickly, but the rate of cooling slowed as the bottles became cooler which shows that the varying rates could be due to the difference of the internal and external temperatures of the bottles rather than the gas composition within.
- The four major greenhouse gases are water vapor, carbon dioxide, methane, and nitrous oxide. Carbon Dioxide is considered to be most important, because it is the greenhouse gas most heavily emitted by humans making up 82% of all emissions. Carbon dioxide, however, has a global warming potential many times smaller than either methane's or nitrous oxide's.
- Global warming is the gradual warming of the earth's atmosphere. The greenhouse effect is a process that traps heat in the lower level of the atmosphere. Greenhouse gases amassed in the earth's atmosphere allow most of the short wavelength, high energy UV radiation from the sun to enter the atmosphere, only reflecting a small portion of the rays. This UV radiation is absorbed by the Earth's surface and the atmosphere. After the absorption occurs, heat is also released, but in the form of infrared radiation that has a longer wavelength and less energy than UV radiation. The greenhouse gases do not allow this infrared radiation to pass through into space and thereby traps the heat within the atmosphere, which works to amplify global warming.
- Venus has a very thick atmosphere, ninety times thicker than Earth's, made mostly of carbon dioxide. This thick atmosphere causes an extremely strong greenhouse effect that heats up the surface of Venus. Mercury's atmosphere is very thin and has little carbon dioxide, so it is unable to trap heat which results in a colder surface temperature.
- The industrial revolution caused a massive increase in the use of manufacturing machines that burned wood or coal as fuel. This constant burning of wood, coal, and later fossil fuels caused unprecedented amounts of carbon dioxide to be released in the atmosphere which greatly increased the greenhouse effect.
- The 10 hottest years on record, in order from hottest to coldest, are 2014, 2010, 2005, 1998, 2013, 2003, 2002, 2006, 2009, and 2007. If this trend continues, we will see a continuing increase in global temperature that could cause such consequences as prolonged droughts, hotter heat waves, bigger hurricanes, rising sea levels, and decreased biodiversity. This will have a personal impact on me, since the weather will become uncomfortable and ineffective for agriculture in some places as is happening in the current drought in California. Also, extreme weather patterns, like heat waves and hurricanes, in less developed areas could trigger a greater need for humanitarian aid that would have to be provided by large developed countries like America. Finally, rising sea levels would magnify the extreme weather events as well as possibly cause damage to large low-lying cities such as San Francisco, New York, and New Orleans, all places I am liable to visit or live in.
 RSS Feed
